orary tech includes profound understanding of its landscape, supporting technologies and integrations. Hence, this article aims to not provide answers, but questions. These questions should guide your choice and prepare your organization for the next decade of digital transformation.
Tag: data visualisation
Making improvements, reaching milestones, increasing productivity – you name it. The products and services of Microsoft assist you to exceed your goals. So many organizations have found using them beneficial. More than 900,000 companies use Office 365, more than half of Fortune 500 are on Azure and 80% are on the Microsoft Cloud. This huge ...
Choosing between SQL and NoSQL database simply comes down to the needs of your business. Rational database works best with structured and consistent data. NoSQL works best with large volumes of data, which don't need to be structured.
BI and data visualisation are integral parts of contemporary data analytics programs. PowerBI and Tableau are great tools, but which one is better?
Having access to predictive analytics and better decision making allows fintech companies to leapfrog and take on the big players in the field.
Building data science teams may be a daunting task – both because of analytics’ transformative power and our species’ tricky fear of change.Yet data science is not a goal: it is merely a tool to achieve better business outcomes. This especially true – and especially important to grasp – for non-technical companies trying their hand at data-driven ...
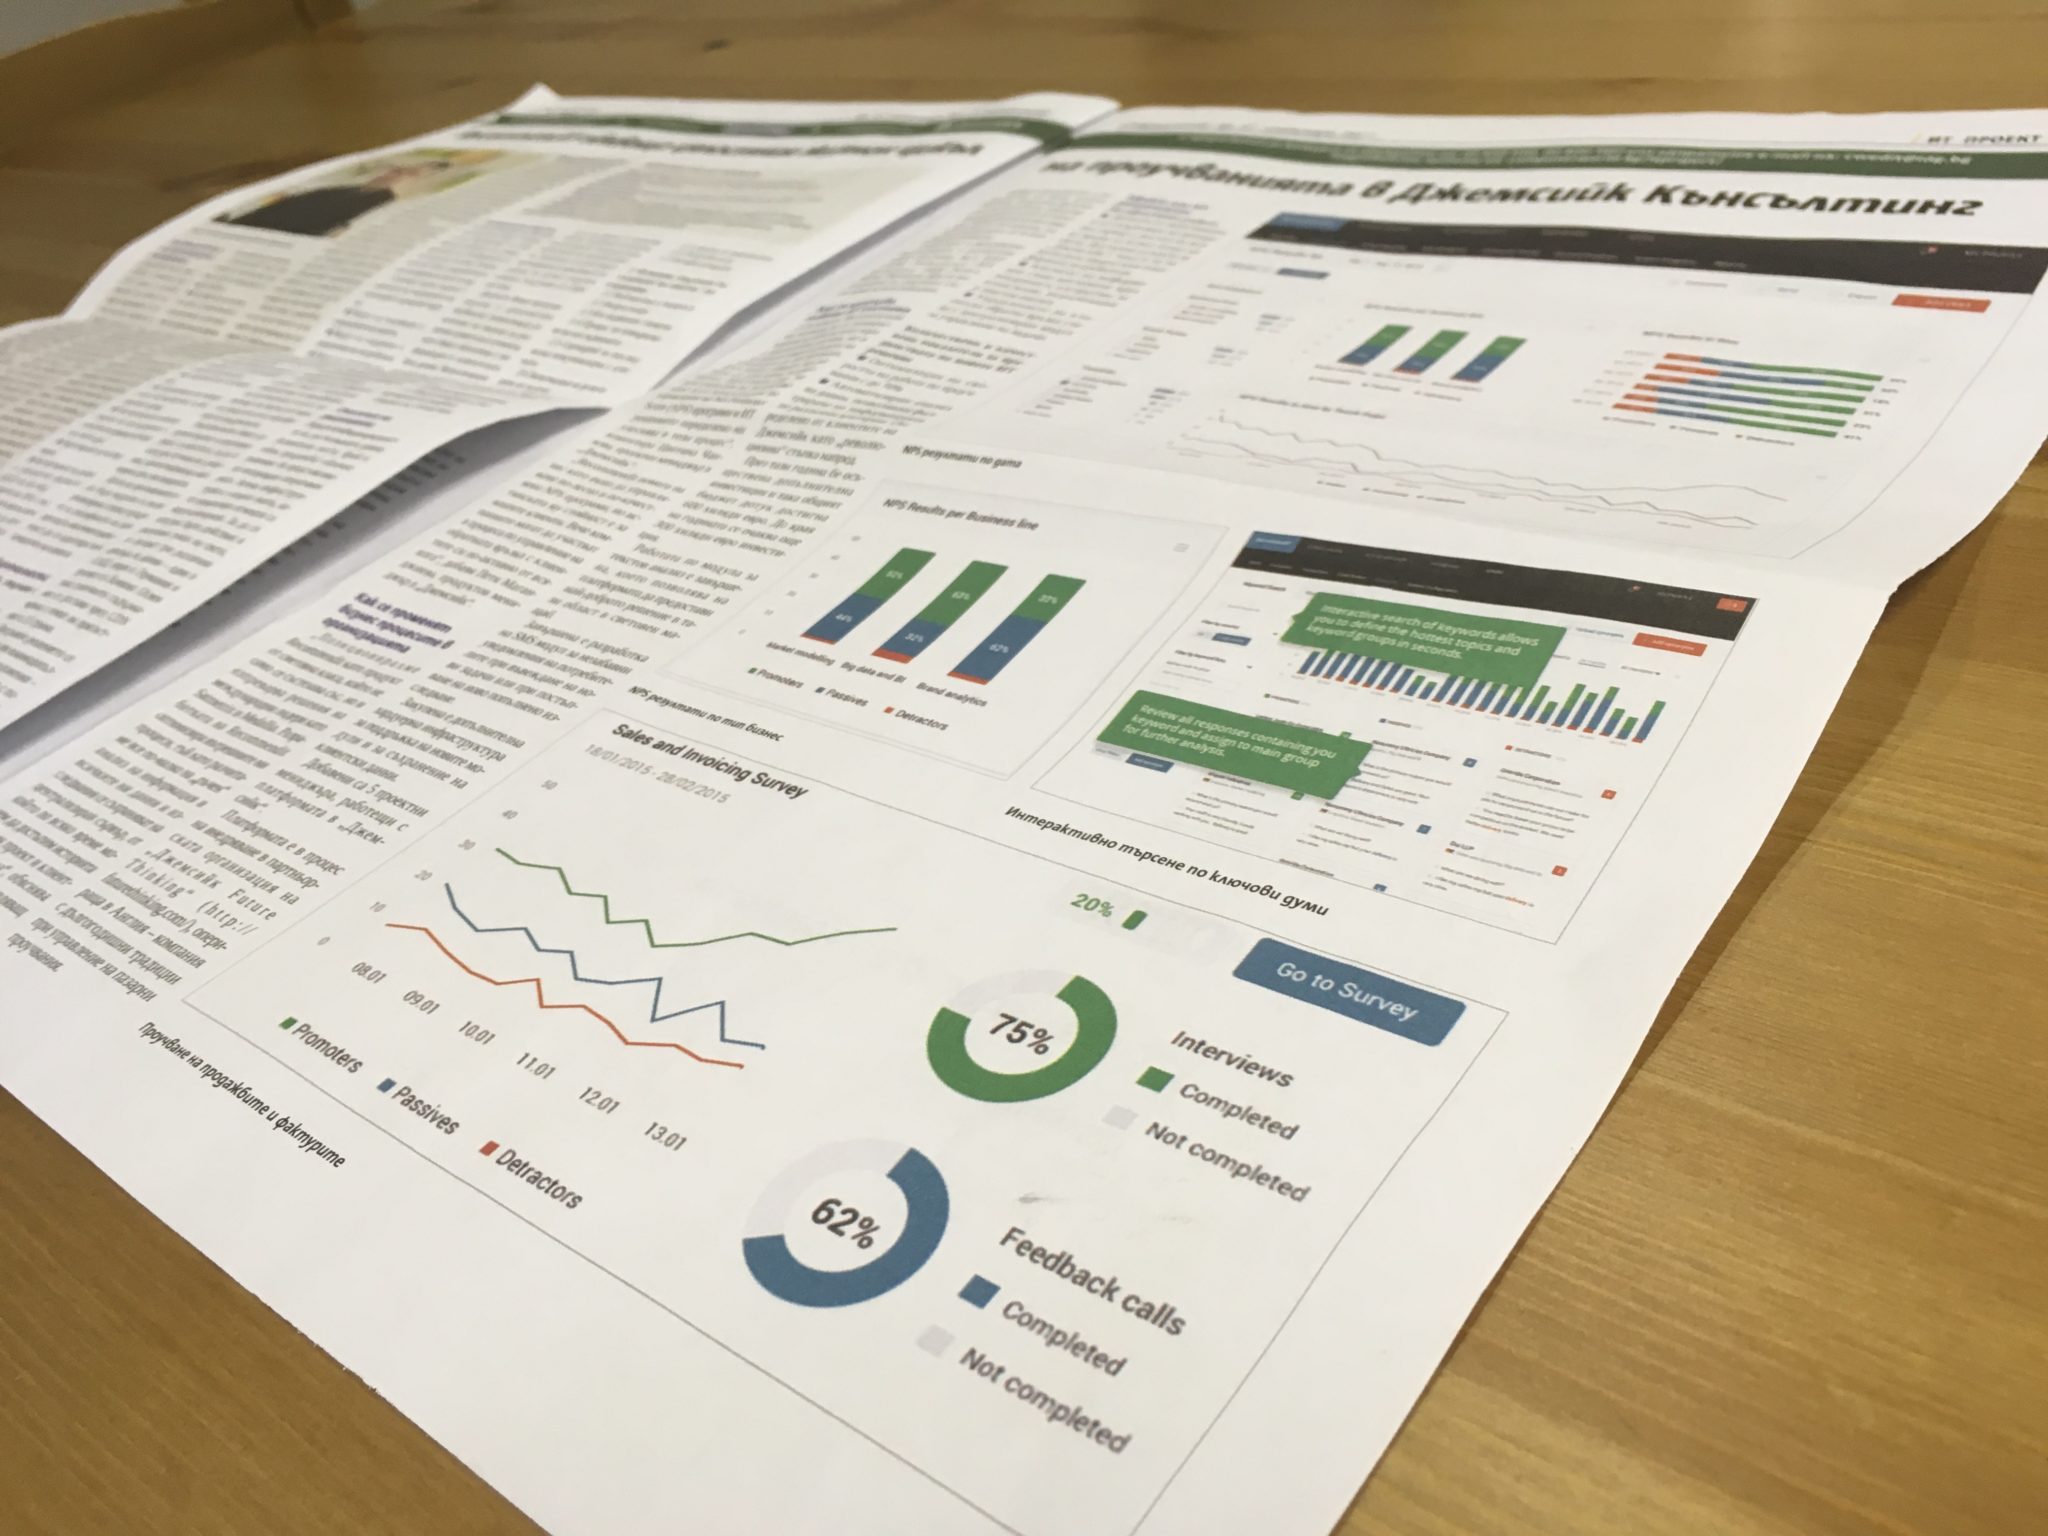
Picture a regular Monday morning, arriving at the office, ready to tackle the day ahead. Then the newspaper we’re subscribed for comes in. It’s Computerworld, a weekly newspaper covering the most important news from the IT industry in the region. A colleague starts browsing through the pages, pauses, lifts his head and shows me screenshots ...


